Laravel Filament 3 Charts 学習メモ
目次
Filament Charts の学習メモ
Charts ドキュメント
Filament Charts ドキュメントはこちら、
https://filamentphp.com/docs/3.x/widgets/charts
https://filamentphp.com/docs/3.x/panels/getting-started#creating-a-chart-widget
まず、widget インストールします。
sail artisan make:filament-widget TestChartWidget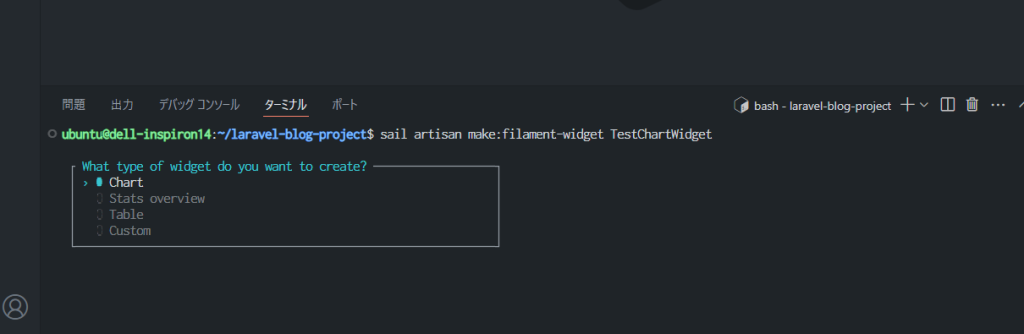
Chart
※空
The [admin] panel
Line chart
を選択。
を選択します。
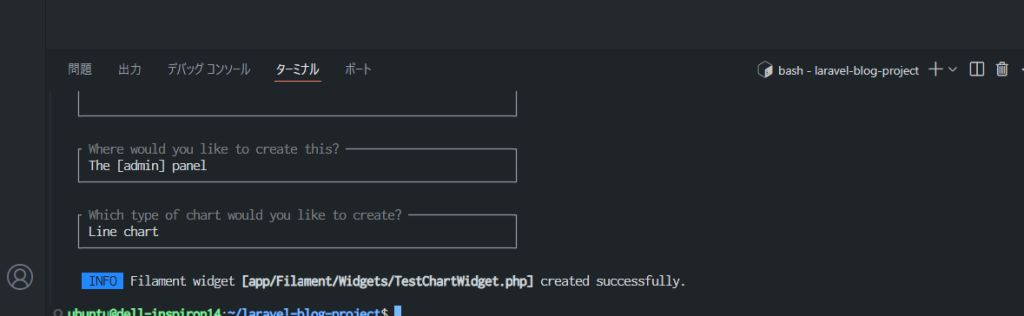
app/Filament/Widgets/TestChartWidget.phpが作成されます。
line グラフ
<?php
namespace App\Filament\Widgets;
use Filament\Widgets\ChartWidget;
class TestChartWidget extends ChartWidget
{
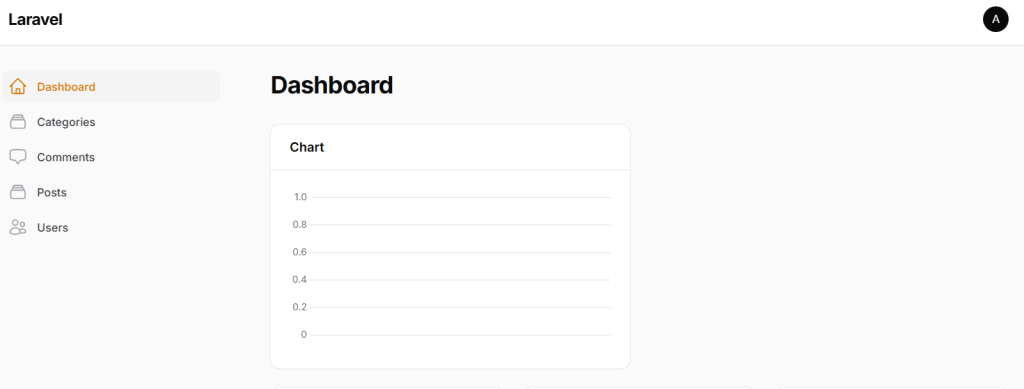
protected static ?string $heading = 'Chart';
protected function getData(): array
{
return [
//
];
}
protected function getType(): string
{
return 'line';
}
}
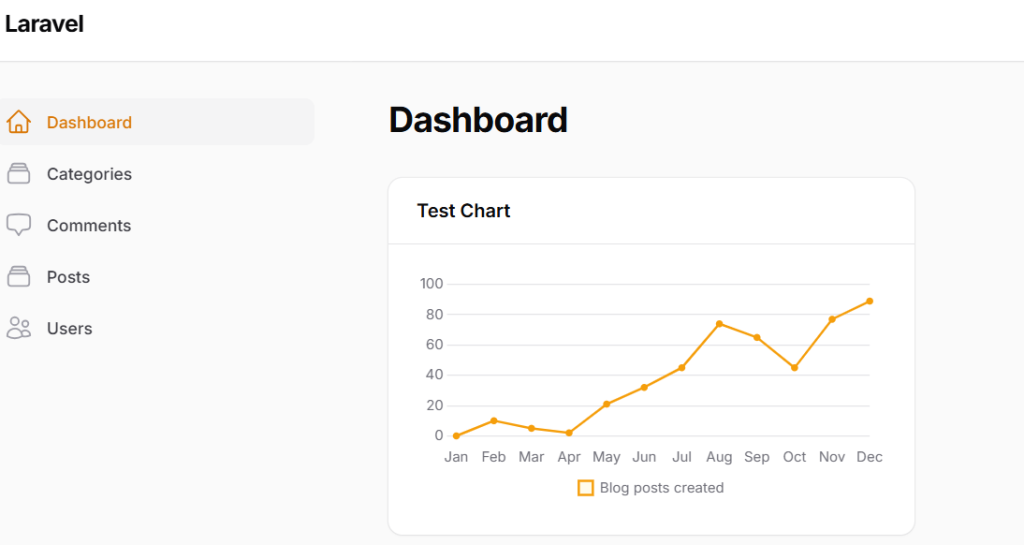
line グラフにサンプルの値をセット
getDataメソッドのreturnに、サンプルグラフ値を記述。
class TestChartWidget extends ChartWidget
{
    protected static ?string $heading = 'Test Chart';

    protected function getData(): array
    {
        return [
            'datasets' => [
                [
                    'label' => 'Blog posts created',
                    'data' => [0, 10, 5, 2, 21, 32, 45, 74, 65, 45, 77, 89],
                ],
            ],
            'labels' => ['Jan', 'Feb', 'Mar', 'Apr', 'May', 'Jun', 'Jul', 'Aug', 'Sep', 'Oct', 'Nov', 'Dec'],
        ];
    }

    protected function getType(): string
    {
        return 'line';
    }
}
以下のようにグラフ表示される。
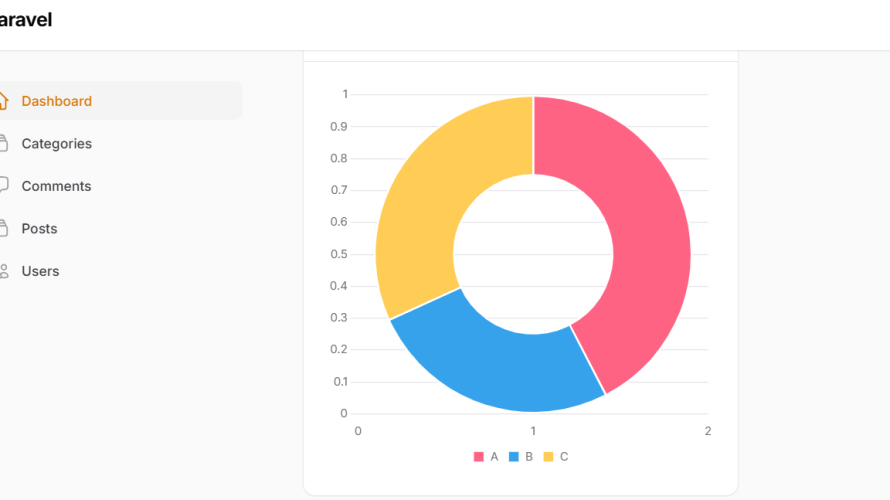
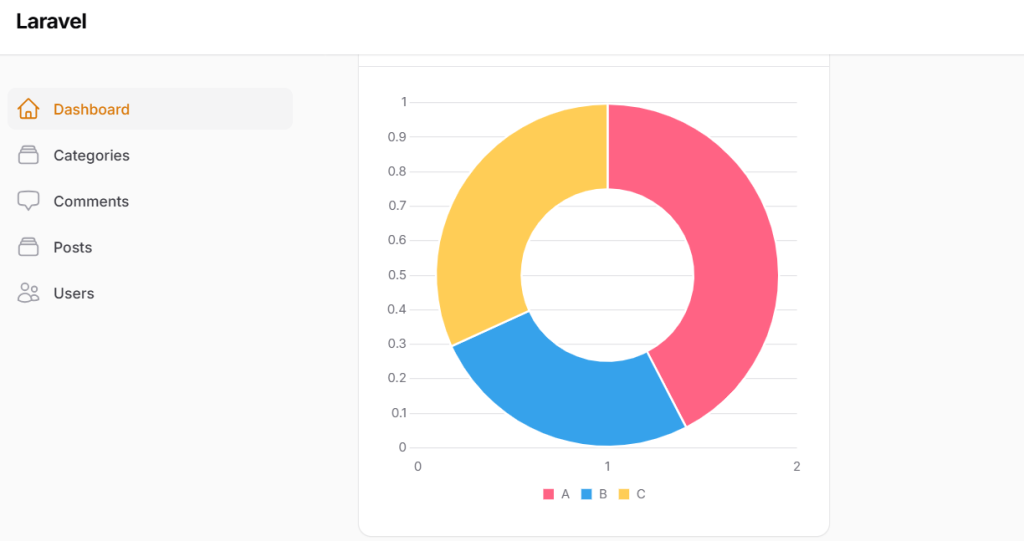
次に円グラフ
<?php

namespace App\Filament\Widgets;

use Filament\Widgets\ChartWidget;

class TestChartWidget extends ChartWidget
{
    protected static ?string $heading = 'Test Chart';

    // protected int | string | array $columnSpan = 'full';
    protected int | string | array $columnSpan = 1;

    protected function getData(): array
    {
        return [
            'datasets' => [
                [
                    'label' => 'Blog posts created',
                    // 'data' => [0, 10, 5, 2, 21, 32, 45, 74, 65, 45, 77, 89],
                    'data' => [600, 365, 450],
                    'backgroundColor' => [
                        'rgb(255, 99, 132)',
                        'rgb(54, 162, 235)',
                        'rgb(255, 205, 86)'
                      ],
                ],
            ],
            // 'labels' => ['Jan', 'Feb', 'Mar', 'Apr', 'May', 'Jun', 'Jul', 'Aug', 'Sep', 'Oct', 'Nov', 'Dec'],
            'labels' => ["A", "B", "C"],
        ];
    }

    protected function getType(): string
    {
        // return 'line';
        return 'doughnut';
    }
}
Laravel trend パッケージ をインストール
sail composer require flowframe/laravel-trend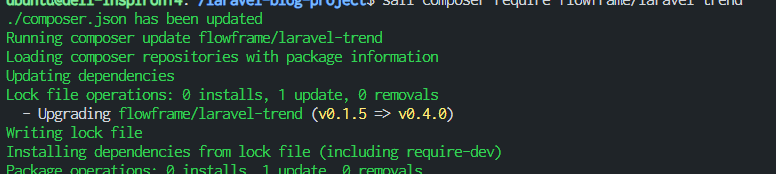
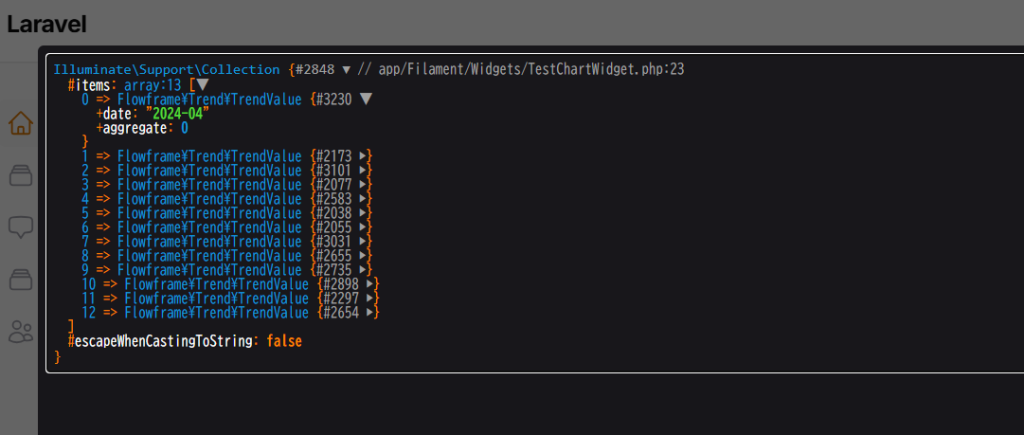
サンプルコードで実際のUser よりデータを取得してみる。取得したデータをデバッグdd
<?php

namespace App\Filament\Widgets;

use App\Models\User;
use Filament\Widgets\ChartWidget;
use Flowframe\Trend\Trend;

class TestChartWidget extends ChartWidget
{
    protected static ?string $heading = 'Test Chart';

    protected function getData(): array
    {
        $data = Trend::model(User::class)
        ->between(
            start: now()->subYear(),
            end: now(),
        )
        ->perMonth()
        ->count();

        dd($data);

        return [
            'datasets' => [
                [
                    'label' => 'Blog posts created',
                    'data' => [0, 10, 5, 2, 21, 32, 45, 74, 65, 45, 77, 89],
                ],
            ],
            'labels' => ['Jan', 'Feb', 'Mar', 'Apr', 'May', 'Jun', 'Jul', 'Aug', 'Sep', 'Oct', 'Nov', 'Dec'],
        ];
    }

    protected function getType(): string
    {
        return 'line';
    }
}
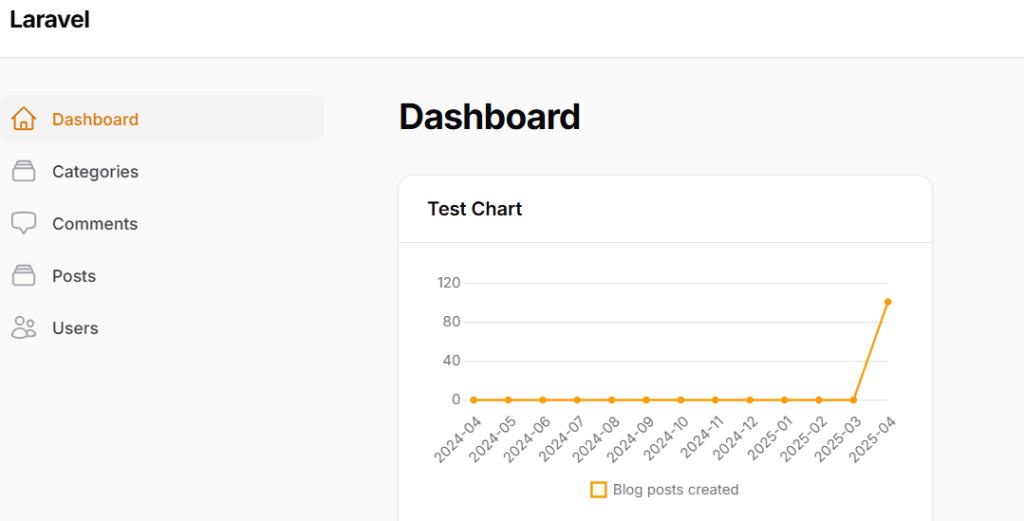
実際のデータでグラフ表示してみる。
<?php

namespace App\Filament\Widgets;

use App\Models\User;
use Filament\Widgets\ChartWidget;
use Flowframe\Trend\Trend;

class TestChartWidget extends ChartWidget
{
    protected static ?string $heading = 'Test Chart';

    protected function getData(): array
    {
        $data = Trend::model(User::class)
        ->between(
            start: now()->subYear(),
            end: now(),
        )
        ->perMonth()
        ->count();

        // dd($data);

        return [
            'datasets' => [
                [
                    'label' => 'Blog posts created',
                    // 'data' => [0, 10, 5, 2, 21, 32, 45, 74, 65, 45, 77, 89],
                    'data' => $data->map(fn (TrendValue $value) => $value->aggregate),
                ],
            ],
            // 'labels' => ['Jan', 'Feb', 'Mar', 'Apr', 'May', 'Jun', 'Jul', 'Aug', 'Sep', 'Oct', 'Nov', 'Dec'],
            'labels' => $data->map(fn (TrendValue $value) => $value->date),
        ];
    }

    protected function getType(): string
    {
        return 'line';
    }
}
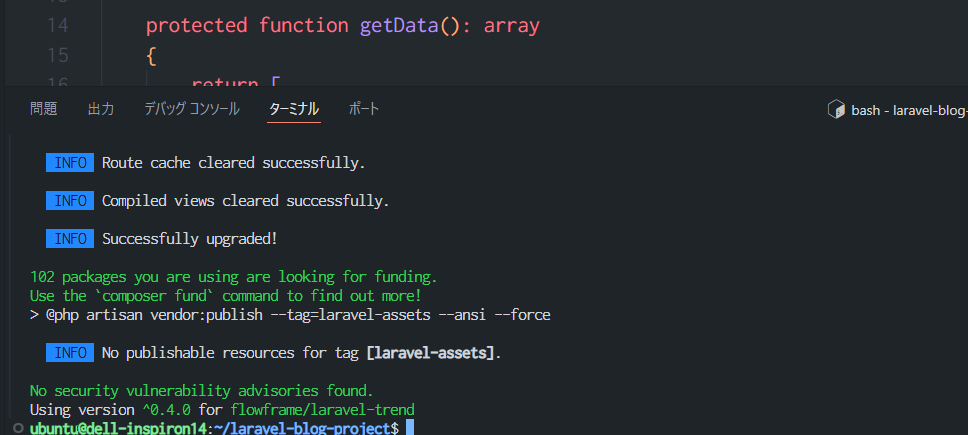
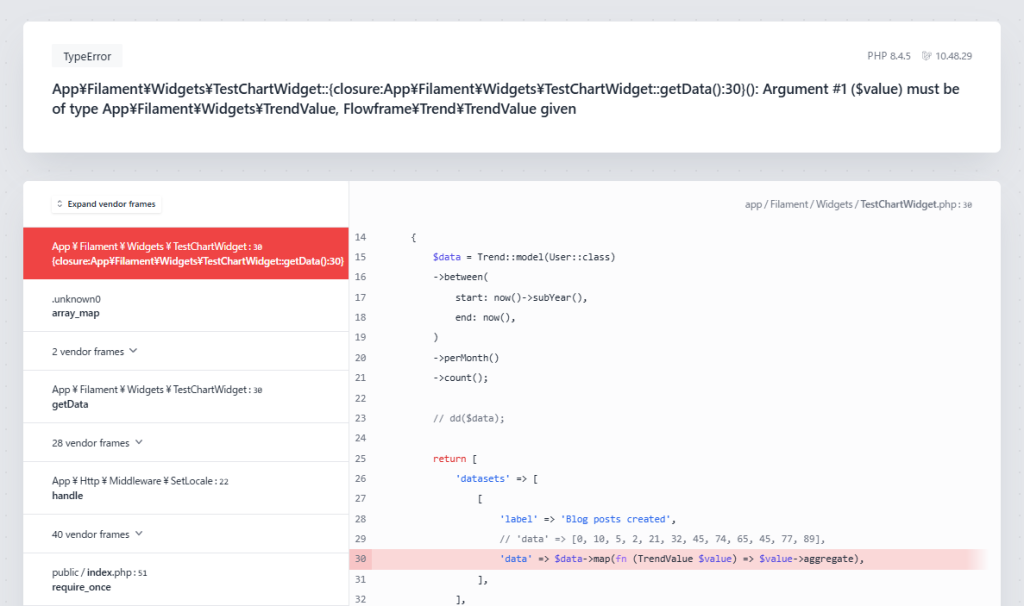
Type Error 発生。今日はここまで。
TypeError
PHP 8.4.510.48.29
App\Filament\Widgets\TestChartWidget::{closure:App\Filament\Widgets\TestChartWidget::getData():30}(): Argument #1 ($value) must be of type App\Filament\Widgets\TrendValue, Flowframe\Trend\TrendValue given
下記の1行を追加する事で解決。
use Flowframe\Trend\TrendValueuse インポートがなかったのが原因。
<?php

namespace App\Filament\Widgets;

use App\Models\User;
use Filament\Widgets\ChartWidget;
use Flowframe\Trend\Trend;
use Flowframe\Trend\TrendValue;

class TestChartWidget extends ChartWidget
{
    protected static ?string $heading = 'Test Chart';

    protected function getData(): array
    {
        $data = Trend::model(User::class)
        ->between(
            start: now()->subYear(),
            end: now(),
        )
        ->perMonth()
        ->count();

        // dd($data);

        return [
            'datasets' => [
                [
                    'label' => 'Blog posts created',
                    // 'data' => [0, 10, 5, 2, 21, 32, 45, 74, 65, 45, 77, 89],
                    'data' => $data->map(fn (TrendValue $value) => $value->aggregate),
                ],
            ],
            // 'labels' => ['Jan', 'Feb', 'Mar', 'Apr', 'May', 'Jun', 'Jul', 'Aug', 'Sep', 'Oct', 'Nov', 'Dec'],
            'labels' => $data->map(fn (TrendValue $value) => $value->date),
        ];
    }

    protected function getType(): string
    {
        return 'line';
    }
}
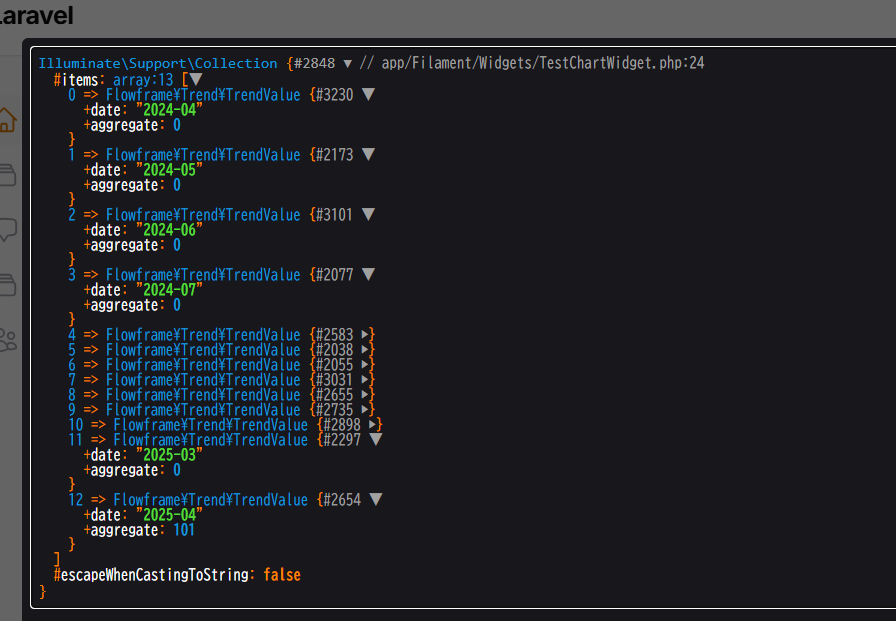
ちなみに下はdd()デバッグ表示データ。
以上。解決です。
-
前の記事

Google AdSense 広告を配信する準備ができました。 2025.04.11
-
次の記事

Laravel Filament バージョン 4 リリース間近 2025.04.13